A great example of Horizontal Position Error on charts

The friendliest place on the web for anyone who enjoys boating.
If you have answers, please help by responding to the unanswered posts.

JDCAVE

Guru
Joined
Apr 3, 2011
Messages
3,010
Location
Canada
Vessel Name
Phoenix Hunter
Vessel Make
Kadey Krogen 42 (1985)
After 3 weeks in the Gwaii Haanas area we are back in Sandspit and civilization. In the Murchison Island anchorage we met up the the CCGV "Otter Bay" that is equipped for the Canadian Hydrographic Service (CHS) and I went over to say hello. I was treated to a tour of their systems, which included a Kongsberg Simrad EM 2040C multibeam-400 beams from 4 transducers and a $150,000 sensor to correct for pitch, roll, yaw, identical to the ones used in cruise missiles:
Many computer screens!
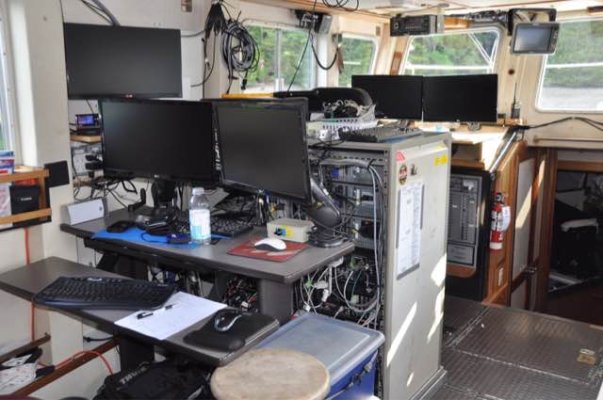
CCGV Otter Bay CHS HA System.JPG
4 transducers and the pitch roll yaw sensor (no step)
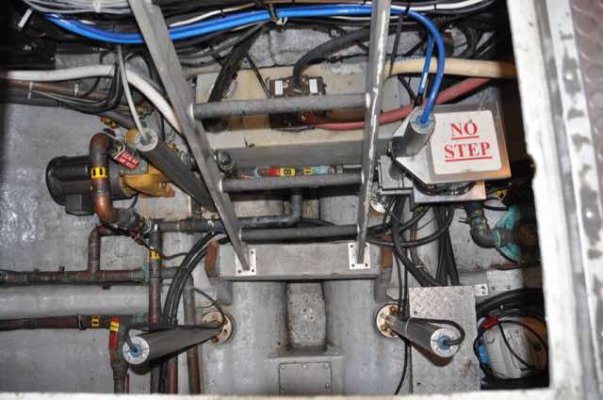
CCGV Otter Bay CHS HA 4 transducers.JPG

So naturally we talked about charts, the quality of the very old soundings in some areas etc. I was especially interested in horizontal position error as I am beginning to,see evidence of it in a number of locations. I was told that in some cases the shore line of whole inlets are out by a considerable measure. The issue is they take a reference location and then triangulate all points along the shore from that location. In some cases the position of that location is inaccurate and the all subsequent measurements are therefor biased. Including the soundings which are referenced to the shore.

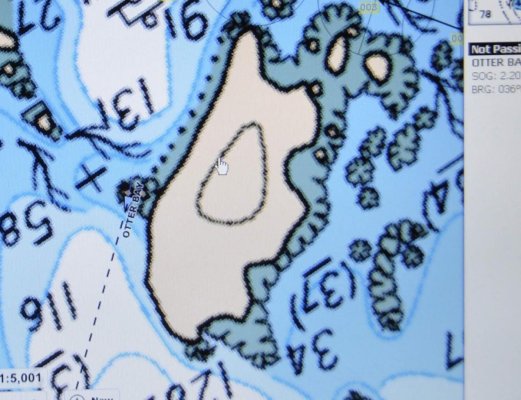
But the most interesting part of my visit with them was watching them leave the anchorage. If you want to understand the consequences of HPE, a photo is worth a thousand words! I wanted to see how they left the anchorage, so switched on my CE with the AIS on and camera ready. The CCGV Otter Bay can travel on land!
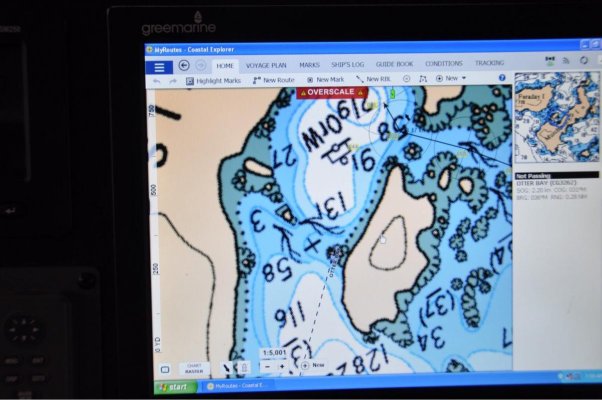
CCGVOtter Bay over a reef.jpg
 
This is a zoom from the same photo:
IMG_0870.jpg
 
JD

Good post. It certainly indicates the potential of reference points being OK on old charts but not OK on GPS charting systems - and why boats hit rocks and shoals even though the GPS says all is well.

Was there a timeline mentioned for moving new data to marine charting systems?
 
Ted: first, I forgot to mention that the position of the dry reef with the AIS signal is the same whether you look at a waypoint on the CHS raster or ENC charts (in Coastal Explorer), or on the Navionics and CHS charts on the iPad. This is an instance where you might better off using the paper charts and take bearings as the errors relate to GPS.

Your point about when the new soundings would be incorporated into the ENCs is more complicated, with (you guessed it) political and budgetary constraints. The senior "technician" aboard had raised the issue with the "powers that be" and it seems that that was not the intended purpose for these surveys.

I'm not going to let this go by without some sort of "snot-a-gram" to the Minister of Fisheries and Oceans, with the points being that such information should be broadly disseminated to the marine community.

There are other issues I want to raise, most particularly the poor surveys of the West Coast of Haida Gwaii, as well as the outer islands on the central coast such as Aristazabel and Banks. For all I know these areas might be surveyed but it's just not broadly known. Evidently the vessel was to spend a month on the east coast of Haida Gwaii before there is a crew change in Bella Bella. From the there, the boat will head south to survey Desolation Sound. Really! Surely that place has been well and truly explored! Me thinks somebody wants a boon-doggle in the tropical waters of DS!

Jim
 
This is true on Grand Bahama island as well. Freeport harbor has been dug out well past Grand Bahama shipyard and the container terminals. At the time (4 years ago or so) we updated charts 5 days prior to arriving. We were "aground and on land for according to Nobeltec.
 
JD


Good post. It certainly indicates the potential of reference points being OK on old charts but not OK on GPS charting systems - and why boats hit rocks and shoals even though the GPS says all is well.


Was there a timeline mentioned for moving new data to marine charting systems?


I seriously doubt this. The only reason a paper chart of the same spot seems "right" is because when looking at a paper chart, you don't know where you actually are. You might triangulate on visual points of reference, but you can do that with any chart. You and the chart could be miss-located by miles and it only seems right because you actually don't know where you are on the planet, just where you are relative to the particular cove. The lat lon grid lines are going to be just as far off in the paper chart as in the electronic chart.
 
Twistedtree you've hit the nail on the head and implied the solution. Bearing and range. Use your radar and your eyeballs, have paper charts at the ready. I don't have a system that overlays radar on electronic charts but I suspect it would immediately show the offest if present.

As Jdcave noted from his conversation with the survey crew the reference point for local survey work could be offset by a considerable distance. If you think about the tools available at the time of older surveys it is totally understandable. However all positions local and relative to the reference point are accurate to that reference point. I've noticed this descrepancy for years. It's better than it was early in the civilian use of GPS for navigation. And maybe that's part of the problem, we seldom see errors so we are not anticipating them. It's good to know the date of the survey the chart is based upon. If it's an old survey and you are transiting a less traveled, by commercial traffic, area then trust radar and paper more than GPS + ENC or Raster.

In my career I was often called upon to take the boat into tight places not recently surveyed and not heavily traveled. After GPS and chart plotters became common my first entrance and exit to a new to me area were always by radar bearing and range. I would then have my GPS track line for future use.

The most challenging was when even the paper charts were questionable and we had to launch the skiff to "discover" the way in.
 
...If it's an old survey and you are transiting a less traveled, by commercial traffic, area then trust radar and paper more than GPS + ENC or Raster...


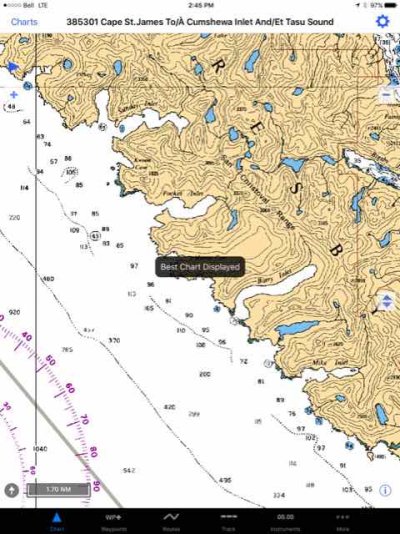
I tend to consult the raster as paper and keep constant watch of the radar and depth sounder, with tight and shallow entries. Most of the charts in region we are in currently are a mix of recent and much older soundings, some with sounding by leadline. Here is a screen capture of the best scale chart for the west coast of Moresby Island, Haida Gwaii. It doesn't matter whether you are using a high priced Nobeltec, a commercial bridge watch ENC system, or my own Coastal Explorer, all use the same source data, with possible bias issues.

IMG_2011.JPG

IMG_2012.JPG
 
Might sound silly to most but I run raster on my laptop, vector on my old Garmin and another vector on my Navionics. My laptop and Navionics charts remain updated. By far, the Navionics is most accurate in horizontal accuracy and water depths.

I remember only a few years ago when folks first saw the GPS chartplotter showing them boating on dry land, the common claim was that it was the error of the GPS positioning. In reality, it's the chart that's off. Of course, back in the OLD days of Selective Availability and pre-WAAS, that was a more likely possibility. WAAS position augmentation has significantly refined positioning accuracy.
 
I seriously doubt this. The only reason a paper chart of the same spot seems "right" is because when looking at a paper chart, you don't know where you actually are. You might triangulate on visual points of reference, but you can do that with any chart. You and the chart could be miss-located by miles and it only seems right because you actually don't know where you are on the planet, just where you are relative to the particular cove. The lat lon grid lines are going to be just as far off in the paper chart as in the electronic chart.

In areas of poor GPS overlays and inaccurate reference points, the concern should be where you are in relation to charted hazards. With common charting tools and surveying knowledge the location of the hazards can be determined, if you have faith in the charts.

Where you are on the planet is not always the issue. Where that ledge is located in relation to your vessel,so you don't run aground, is paramount.
 
Where you are on the planet is not always the issue. Where that ledge is located in relation to your vessel,so you don't run aground, is paramount.
The best way to determine that is bearing, range and observation from identifiable landmarks. You don't have to use paper, but you do have to ignore the GPS lat / long and use the electronic chart as if it were a paper chart.
 
The best way to determine that is bearing, range and observation from identifiable landmarks. You don't have to use paper, but you do have to ignore the GPS lat / long and use the electronic chart as if it were a paper chart.

When I called for a tow a few weeks ago they asked me for my GPS location. When they looked up my location, it showed me a few blocks inshore.
 
When I called for a tow a few weeks ago they asked me for my GPS location. When they looked up my location, it showed me a few blocks inshore.

If I remember you were just outside the entrance to Gig Harbor? I'll bet that was an error on their part plotting your position. Salish Sea waters chart offsets have been very well corrected for a long time.
 
Twistedtree you've hit the nail on the head and implied the solution. Bearing and range. Use your radar and your eyeballs, have paper charts at the ready. I don't have a system that overlays radar on electronic charts but I suspect it would immediately show the offest if present.

As Jdcave noted from his conversation with the survey crew the reference point for local survey work could be offset by a considerable distance. If you think about the tools available at the time of older surveys it is totally understandable. However all positions local and relative to the reference point are accurate to that reference point. I've noticed this descrepancy for years. It's better than it was early in the civilian use of GPS for navigation. And maybe that's part of the problem, we seldom see errors so we are not anticipating them. It's good to know the date of the survey the chart is based upon. If it's an old survey and you are transiting a less traveled, by commercial traffic, area then trust radar and paper more than GPS + ENC or Raster.

In my career I was often called upon to take the boat into tight places not recently surveyed and not heavily traveled. After GPS and chart plotters became common my first entrance and exit to a new to me area were always by radar bearing and range. I would then have my GPS track line for future use.

The most challenging was when even the paper charts were questionable and we had to launch the skiff to "discover" the way in.

This isn't really what I'm tryign to say. Kind of the opposite, actually.

I think there is zero, none, nada, no difference between a paper chart, raster electronic chart, or a vector chart, assuming all are of the same vintage. No one will help you more with navigation than the other.

What confuses people is that with an electronic chart it's possible to put a little dot showing you the lat/lon of your boat. Now if the lan/log registration of the chart is wrong (incorrectly geo-referenced), then the dot will appear to be in the wrong place, and yes, that is distracting. And it can be disastrous if you are assuming that dot location is correct and not paying attention to other clues that it might be wrong.

When you pull out a paper chart, it is no different than the chart on your screen, except there is no dot. You have to figure out your position some other way. You can do that on an electronic chart just the same as a paper chart.

A paper chart has no magical powers, unless of course you consider it magical to be blind to your location on the planet. If that's the case, then just turn off your GPS.

Actually, as I re-read your post, I think maybe we are saying the same thing. Sorry for jumping to the wrong conclusion.
 
Last edited:
In areas of poor GPS overlays and inaccurate reference points, the concern should be where you are in relation to charted hazards. With common charting tools and surveying knowledge the location of the hazards can be determined, if you have faith in the charts.

Where you are on the planet is not always the issue. Where that ledge is located in relation to your vessel,so you don't run aground, is paramount.

Agreed. But that has nothing to do with paper vs electronic charts. It has to do with charts that aren't geo-referenced correctly, recognizing that, and switching to alternate nav methods like bearing lines to determine your position.
 
I think we are all preaching to the choir here. It's a case of user beware. I was not aware how extensive (and expensive if you will excuse the alliteration) the problem was until recently. I was also not aware (until chatting with these people) that the soundings in near-shore areas were so closely tied to the charting of the shoreline. Historically they were offsets from the shoreline. And by historical, it's not that long ago that there was no GPS. Some surveyors were better at their assignments than others.
 
This isn't really what I'm tryign to say. Kind of the opposite, actually.

I think there is zero, none, nada, no difference between a paper chart, raster electronic chart, or a vector chart, assuming all are of the same vintage. No one will help you more with navigation than the other.

What confuses people is that with an electronic chart it's possible to put a little dot showing you the lat/lon of your boat. Now if the lan/log registration of the chart is wrong (incorrectly geo-referenced), then the dot will appear to be in the wrong place, and yes, that is distracting. And it can be disastrous if you are assuming that dot location is correct and not paying attention to other clues that it might be wrong.

When you pull out a paper chart, it is no different than the chart on your screen, except there is no dot. You have to figure out your position some other way. You can do that on an electronic chart just the same as a paper chart.

A paper chart has no magical powers, unless of course you consider it magical to be blind to your location on the planet. If that's the case, then just turn off your GPS.

Actually, as I re-read your post, I think maybe we are saying the same thing. Sorry for jumping to the wrong conclusion.

I'm glad you noticed.

I would like to see the mechanism that produces an incorrect electronic chart for the baseline paper chart.

As you first pointed out, the paper chart only seems correct.

I did learn a very useful fact which is the soundings are referenced to the shoreline. Now that's news i can use.

In Sweden, where there are a trillion rocks, I was told to use Navionics Europe HD. No paper charts needed.
Made sense to me and i never saw anything incorrect.
 
I did learn a very useful fact which is the soundings are referenced to the shoreline. Now that's news i can use.


Careful. I think that only applies to nearshore areas such as inlets, pre-GPS. I want to be really careful not to misrepresent the methods in this case. But it is intuitive to me. You go into some bottle-neck Inlet somewhere the first thing I would do is create the outline of the bottle (shoreline) then fill the inside of the bottle with soundings. If you are in a rowboat with a leadline, and there are two guys onshore with theodolites, they can triangulate on you while you do the soundings. But two of those onshore locations must be accurate geo-reference points on which all other measurements are taken. If just one of those is inaccurate, then all subsequent measurements are biased. That is what the technicians termed "propagation error.

Peter: am I wrong with this interpretation?

Jim
 
Also important, the technicians deploy a towed device that measures the speed of sound. This takes into account water temperature and density.

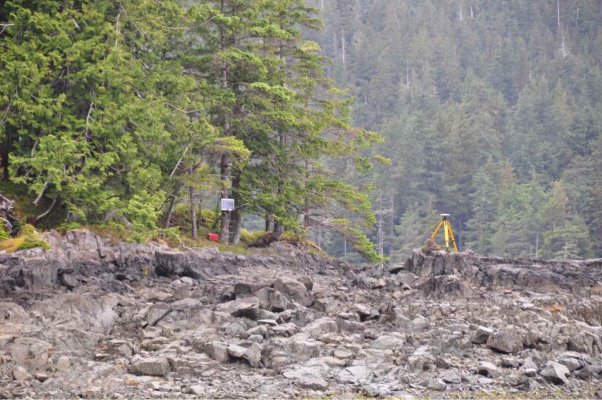
The onshore site at Murchison Island that was set up by the CHS technicians.
CHS Shore based location.jpg

The CCGV Otter Bay

CCV Otter Bay.jpg
 
I think the real game changer of the future is real time updating/crowd sourcing of your vessel's location and water depth and a refinement of alignment references from onboard radar verification on units like TT and many others here operate. Digital radar is a powerful tool. I've seen aviation systems that provide a precision 3D approach using onboard radar and database comparisons/calculations to provide a self-contained, precise positioning system.

Look what Google Maps is doing now with road mapping and routing. It's coming to the maritime world, too.

I predict that eventually we will all be contributing to the database through the autonomous actions of our electronics for chart accuracy and safest route calculations of future mariners.
 
The problem with crowd sourcing is calibration of the equipment. It's one thing to run a sounder and radar. Its useful to the individual. It's another thing to calibrate the equipment to scientific standards. From professional experience, proper scientific collection of hydroacoustic data requires beam mapping of transducers, collection of speed of sound data for difference water masses, target strength measurements, target verification, as well as realtime beam orientation measurements. I mentioned the pitch role yaw sensor from the cruise missile. I'm not aware of any such device on recreational or commercial vessels, but it's a critical piece of equipment in the collection of modern bathymetry data: it is critical to know the absolute orientation of the beam. Anything off-vertical will result in overestimated water depths.
 
It's the degree of inaccuracies that makes the difference. If 20 boats pass over a spot with known tidal effects factored in, the outliers and the mean are mathematically attainable. It's bound to be more accurate than that NOAA chart printed in 1957.

Crowd-sourcing of depth bathymetry is currently being done by Navionics in their Sonar Charts. Vessels with depth sounders connected to Navionics chartplotters are autonomously connecting through wifi to upload their data for Navionics to crunch and regurgitate into chart form. I subscribe to their service and am finding new fishing holes and grounding shoals ...clearly marked...that do not exist on the vector or raster charts.

All this is available to me on a $150 tablet! I'm impressed so far.
 
Last edited:
Yes, I am aware of what Navionics is doing and I know it's all the rage, but in my view and as I have described above, there is more to this than having 20 boats collect data and then averaging the data after correction for tidal fluctuations. As I have mentioned, I have a background in managing a hydroacoustic program, albeit for the estimation of salmon passage upstream. There are complexities in the gold standard collection of such information.
 

Latest posts

Back
Top Bottom