Ballast bar on steel keel?

The friendliest place on the web for anyone who enjoys boating.
If you have answers, please help by responding to the unanswered posts.
should add it is attached to a long string using gravity to measure at ground level what otherwise may not be measured. ie: To measure beam of a boat.
Is it your suspicion that the beam number I have is not accurate?
To my understanding, the superstructure was created during construction. It was not modified later, at all. The survey I quoted earlier says 14'3" beam. I am not sure about the waterline, which is listed as 46'10".
Either way, when I haul it out in June, I will measure these again.
No, just saying how to use it
 
LeoKa,

I didn't read the details of the 2008 survey carefully. There are some more numbers and statements there that both answer and raise additional questions.
To my understanding, the superstructure was created during construction. It was not modified later, at all. The survey I quoted earlier says 14'3" beam. I am not sure about the waterline, which is listed as 46'10".
The 2008 survey says:
"This is a 54' custom steel vessel that is a Bruce Robert's design for a motorsailer that was modified by Glen Freidhom to a pilothouse vessel."
In addition, the 2008 survey says:
it was BR sailboat design, but modified to pilothouse vessel. The modification included by removing the extended keel and adding a full superstructure.
"Signs where 8' long rolling chocks have been removed port and starboard. I-beam was installed on forward portion of the keel. It has reportedly cruised to Alaska with no problems."
"LWL 46'10", beam 14'3", draft 5'9", GDR 38 Net 30T, fuel 880g."

The fuel is now 1200 gallons. 400+400 each side and 200+200 in the keel tanks. So, something was changed. Notice that the draft is now 7.4 not 5.9 as it is in this survey.
That's a lot of confusing information. When I look at an old survey, the first thing I think about is how complete/complex was the survey. One gets what they pay for. It is possible for an inexpensive "in water" survey, which I wouldn't consider to be a survey. We know that this one wasn't in water because of the reported "Signs where 8' long rolling chocks have been removed port and starboard. I-beam was installed on forward portion of the keel. It has reportedly cruised to Alaska with no problems." However, those statements, and many others, seem inconsistent.

First, was this a modified Bruce Roberts design for a motorsailer or a sailboat? A sailboat of this size would probably have an engine of 100 hp weighing 1,000 pounds. I don't imagine that a motorsailer design would need to increase engine size as hull speed is hull speed on a full displacement. Presumably, a motorsailer would motor a lot more than a sailboat. So how much fuel would one carry for a 100 hp motor in a sailboat? 150 gallons? If the design was for a motorsailer, maybe 300 gallons? That would require the motorsailer design to accommodate the weight of the engine (#1,000) and the "increased amount" of fuel (#2,100). Ex-sailors here on TF might shed some light on fuel capacity. My old 32' sailboat only had a 12 gallon tank. Obviously old school.

Your original owner installed a CAT engine weighing #2,200 (minus the transmission) and 880 gallons for fuel (weighing #6,160). Later, the owner added keel tanks for an additional 400 gallons (#2,800) or a total engine/fuel weight of at least #11,160. Add in the transmission weight and that would be maybe 6 times the original design weight for engine/fuel? And then at 300 hp there is the issue of having 3x the likely required horsepower for this hull design.

One question is "why were the rolling chocks installed and why removed?" Just as a guess, but I would say that Bruce Roberts sailboat designs don't feature rolling chocks. I looked around at his website and didn't see any designs that feature chocks. Regardless of the why on the chocks and I-beam, those changes indicate that the following statement in the survey ("It has reportedly cruised to Alaska with no problems") is very, very questionable. Not that the original owner didn't report that or actually cruise to Alaska, the iffy part is "with no problems." That would require one to believe that the boat was hauled and rolling chocks were installed just for fun. It was later hauled and they were removed just for fun. The iron beam was welded to the forward part of the keel just for looks? It now appears like more was welded on aft. Yet another after construction modification for no reason?

(Some have mentioned that rolling chocks might be a solution to address stability problems. No, but they can mask them. One can only guess as to why chocks were installed and removed. One would hope that a surveyor would ask and report).

I would postulate that all of these alterations were post-construction and intended to address a problem. A problem that existed when cruising to Alaska. A problem that still exists. A problem that may have convinced owner #2 that the vessel's best usage was as a floating condo in a quiet marina. It is possible that the original owner didn't have any problems in the calm of the inside passage to Alaska, but that is different from coastal cruising and much different than inferring that a latent problem does not exist. It is a version of "I smoked for years with no problem," implying that there's no problem with smoking.

It looks like the surveyor did ask the original owner some questions. While the surveyor may have measured LOA, beam, and waterline length, it is also possible that he/she simply asked the owner who, having constructed the vessel, would likely have the numbers in his head. What makes me think many numbers may be "owner answer" numbers is the inclusion of net tonnage. One can hire a service to calculate gross and net tonnage, and there is a USCG approved quickie calculation for recreational vessels (when documenting), but I would guess that the net tonnage number was something that the owner/builder had in his head. Same would be true with if the LOA on the survey is reported as a "Bruce Roberts 54." That is not a measurement. The draft might also be owner supplied and 5 foot 9 inches is what the designer spec'd. If that is the design draft and the measured draft now is over 7 feet, that's an issue. While perusing the Bruce Roberts website, I did see that his vessels of this size had drafts of 5-6 feet. Drafts of 7 feet and over were only on his larger designs (over 60' LOA). One can also see that the Bruce Roberts boats of this size which convert his sailing designs to a motorsailer use all aluminum for the fabrication of a little bitty pilot house. There is a reason for that.

I'm curious what "GDR 38" means in the old survey. Google says it's a designation used for boats built in the German Democratic Republic. Obviously not here, but could it be gross tonnage? If so, another number that likely came from the original owner. May or may not be of use.
 
Marco.
I think you are correct on all counts. Unfortunately, I do not have any supporting information to back it up.
The survey I mentioned was done for the second owner. He paid for it. Where the surveyor got the info for those numbers and statement, I have no clue.
I spoke to the second owner, but he did not remember anything and he does not know more than the survey says. So, you might be accurate that things could be out of order. It was a 'for sale' survey.
When I haul out in June, I will measure the waterline, beam, length. I just bought the Plumb Bob today. I will also ask the boat lift operator, if they can measure the weight, but I am not sure about it.
About the draft. Is it possible that the I-beam addition increased it?
Historically, I think, first was the BR motorsailer design to be built. Later, a NA suggested the I-beam, air-tank, keel-tank, bilge-lead, I-beam weight, additions. Did this solve the problems? I do not know.
While I was sailing down from Puget Sound, my worry was about the 20-22 degrees rolls and the following swells dragging the stern to all directions. This could be the result of the unsolved problems, but also not securing everything properly and the extra weight on the top. Since then, I reduced the weight on the top dramatically and will do more. I am also working on securing everything inside, so there will be no shifting, when I go out again. I cannot tell, if this will make the boat more capable for coastal cruising? Maybe not. All I want is to sail South little by little, watching the weather very carefully, and not to be on schedule. If I can make it to MX, my goal is accomplished. I am not dreaming about long crossings anymore.
 
Marco has given you excellent insight into the questions that need to be answered. As well as concerns about stability of the boat. You have learned how much weight aloft matters. As well as how shifting weights matter. Every pound you can move lower, every pound you can keep from shifting matters.

I don't know what seas you experienced but 20 - 22 degree rolls could be par for the course or serious cause for concern. It certainly is alarming if you are not accustomed to such rolls.

Following seas pushing the stern around are unfortunately part of running down swell. If you've got a boat that can match the speed of the waves you can find the sweet spot. In theory. Trouble is the Washington coast is usually confused seas. A dominant swell, sometimes a lesser swell and different angle. Both generated far offshore. Then wind wave on the top of the swells at yet another angle. You won't find Oregon and Northern California much different.

If you boat hasn't got any extra speed then control the energy you put into the system. In other words, try slowing down. I know it runs counter to much of the advice given but it's the only tool in your kit if you have a slow boat. It took me a lot of hard lessons to finally learn that one. Just don't go slower than good steerage speeds.

I also see advice to hand steer vs letting the AP do it's job. That's another hard learned lesson for me. No matter how much I try I have yet to prove that I can do better than the AP hour after hour day after day when running the coast. Crossing a bar that's a different matter. Hand steer, hands on the throttle, ready to adjust as needed.

My other bit advice is don't let yourself get locked into making Portland to Mx in one season. You've got a boat that by your description is marginal for your plans. Budget for wintering somewhere along the way.
 
If you boat hasn't got any extra speed then control the energy you put into the system. In other words, try slowing down. I know it runs counter to much of the advice given but it's the only tool in your kit if you have a slow boat. It took me a lot of hard lessons to finally learn that one. Just don't go slower than good steerage speeds.

This is a big one. With some boats getting too close to the speed of a wave produces the worst handling, as the boat spends more time mushing around on top. Slowing down and letting the waves pass you faster sometimes produces better results, especially if you can't or don't want to speed up to run with or ahead of the waves.
 
I'm not sure that my statement of the weight of the added diesel tanks is correct. Are the added "keel tanks" the blister looking things visible on outside of the keel?" Or are they tankage that was added inside the original keel area?

Also, as to the reported 22 degree rolls, I've been looking for a recording inclinometer to accurately track rolls, including maximum, for some stability analysis on my boat. Do you have one or is 22 degrees a guesstimate? From my own experience, I've noticed that as roll angles increases my perception of the roll angle really increases. 10 degree seems like 15. 15 would seem like 30. Inclinometers don't (usually) lie. I can't even find a simple one with a "drag needle" to simply record maximum roll. Maybe I need to fabricate one. Thinking that I'm going to accurately look at an inclinometer while knocking back and forth at 12 degrees is not realistic for me.
 
If you boat hasn't got any extra speed then control the energy you put into the system. In other words, try slowing down. I know it runs counter to much of the advice given but it's the only tool in your kit if you have a slow boat. It took me a lot of hard lessons to finally learn that one. Just don't go slower than good steerage speeds.

My other bit advice is don't let yourself get locked into making Portland to Mx in one season. You've got a boat that by your description is marginal for your plans. Budget for wintering somewhere along the way.

Very useful advice.
My boat is slow, so speeding up is not an option. Slowing down I can do. I think I should have done it on that trip. Unfortunately, I was in a hurry. Solo, no radar, no anchorage. It still took me 23 hours strait from Neah B.
My future sailings will not be on schedule and I will not force myself again.

My autopilot was working fine, but I had to steer a lot due to the crab pots.

Where do you recommend wintering?
 
This is a big one. With some boats getting too close to the speed of a wave produces the worst handling, as the boat spends more time mushing around on top. Slowing down and letting the waves pass you faster sometimes produces better results, especially if you can't or don't want to speed up to run with or ahead of the waves.
I don't mind slowing down. I have plenty of time.
 
Also, as to the reported 22 degree rolls, I've been looking for a recording inclinometer to accurately track rolls, including
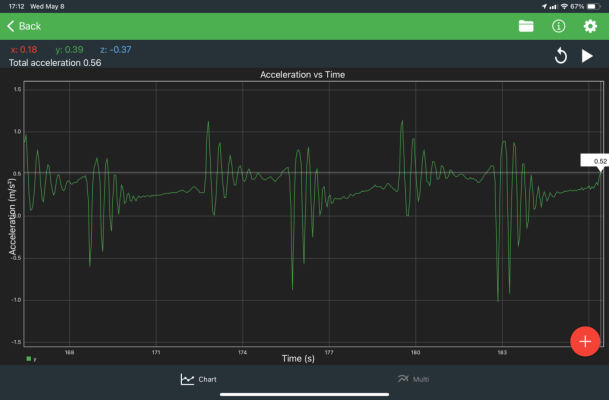
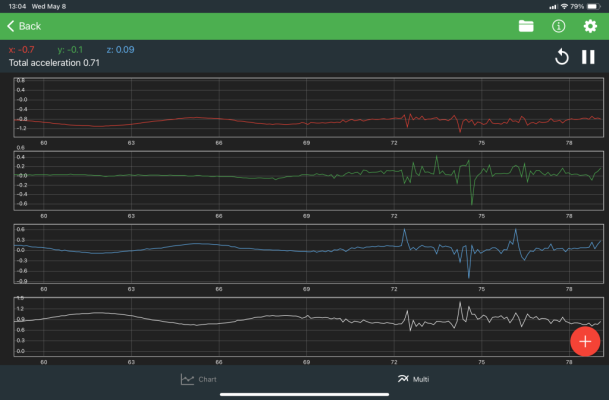
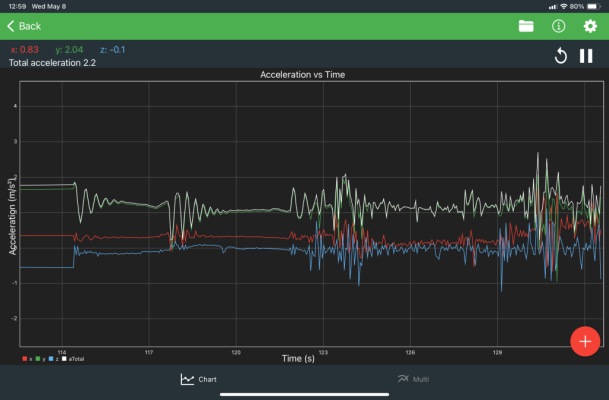
The 22 degrees comes from my RM plotter. It shows on the screen and I was glued to this plotter, since I had no radar.
 
I'm not sure that my statement of the weight of the added diesel tanks is correct. Are the added "keel tanks" the blister looking things visible on outside of the keel?" Or are they tankage that was added inside the original keel area?
I don't know when and how it was added. The fill up pipes are inside the ER right at the bilge. My guess, it was welded on later.
 
I don't mind slowing down. I have plenty of time.
reslifkin's response to my posting makes an excellent point. Do not slow down only to find you spend as he said a lot of time mushing around on top. That is a VERY risky position. You don't have as much hull in the water as you need for good stability. The boat is very easy to upset. It may feel gentle, but that can be because there is not much righting energy at work.
 
I did the test with the app, but I cannot attach the resulting files here. It seems .cvs and .pdf files are not permitted.
Lots of number in these files, so I do not have a clear understanding of them. The second test was when I had the boat already moving up and down and I stepped off the deck onto the dock. This is when I started the recording and I let the boat calm down. The total time for this was 36 second. So, from the most rolling to the least.
I suppose this is the number we need?
When did the rolling test in the past, I was timing the whole time, which included starting the roll from calm, going up to the max, and letting the boat to calm down again.
The weather is calm and the water is flat. The dock lines did some holding, but not significantly, against the roll to Port.
The roll numbers in the test are starting at 2.067, going up to max 3.011, and calming down at 2.034 number. These are not degrees, but shows what the app is registering for the roll.
 
Since I am not sure, if I interpreted the data correctly, let me brake it down somewhat.
The file of the last test with the inclinometer.
started at 08:37:18.53 roll is: -2.067
at 08:37:22.54 roll is: -3.011 max
at 08:37:25.85 roll is: -1.834 min
at 08:37:29.66 roll is: -2.64 max
at 08:37:32.97 roll is: -2.001 min
at 08:37:36.69 roll is: -2.49 max
at 08:37:40.50 roll is: -1.759 min
at 08:37:44.11 roll is: -2.339 max
at 08:37:46.72 roll is: -1.961 min
at 08:37:50.73 roll is: -2.231 max
at 08:37:55.65 roll is: -2.034 min
This was the end point when the boat was almost steady.
It looks that one sine interval max to max is about 7 seconds. The total time for start to steady is 33 seconds of this test. The start was the point when I stepped off the deck and the boat was at the most degree roll.
I did not see my instruments, but it felt the max roll could have been between 6-8 degrees.
 
You don't need .cvs file data for this. You are only interested in timing the roll accurately. Hopefully, your app has just a visual graphing function that you can save. Look at post #68 in the thread linked below. The first picture is a screen shot of the accelerometer while I was rocking my boat. The first couple of spikes on the left have a little sharp spot at top and bottom. That is because I was rocking the boat and the accelerometer is sensitive enough to show that. But when I let it rock freely, I ended up with a spike right on the 40 second mark. Then I just happened to get another spike just past 60 seconds. Let's call that 61 seconds. Counting the spikes in that time period, we have 6 spikes (i.e., 6 complete rolls) from 40 to 61 seconds. 6 spikes in 21 seconds = 3.5. A roll period of 3.5 seconds.

My beam is 11' 6" feet or 3.5 meters. 3.5m / 3.5 sec = 1.

Sounds like you came up with closer to 7 seconds. Whether 6 or 7 seconds, that's still a long ways off. Did you have the portable water ballast tanks full for this?

 
Marco.
No matter how much I try to figure out this app, I cannot get an interval for the data. I mean, the graph moves so fast that I can only see few seconds on the display. Yes, I can get a screenshot, but it would only show few seconds. If I change the settings to slower sampling (1s), nothing shows on the graph. The app does not allow me to go back in time and see a summary of the events.
If I record the rolling, it only allows me to save it as a .cvs file. No graphic option.
 
I wouldn't worry about trying to data log the rolling. Timing it manually is plenty accurate for this purpose. Just get the boat rolling, then time how long it takes to get from the peak of the roll in one direction to the other side and back to peak in the first direction. The actual amount of roll occurring isn't particularly important for this test, and neither is the number of cycles it takes for the roll to decay.
 
The app I'm using is Physics Toolbox. It can create a graph for several minutes, or longer, if your boat can rock that long. (All you need to graph is the Y function.) Then hit the pause button at the top of the screen. Use your fingers to "pinch" the graph on the phone screen to get as much of the graph as is "clean" after you rocked the boat. Then place three fingers on the screen of your phone and a screen shot will be sent to your picture library. That allows you plenty of time to look at the picture, count 10, 15 or 20 rolls and divide by the time. Easier to tell 3.9 seconds from 4.1 seconds. Might not be too important if your roll intervals are as long as you have suggested. But it can tell you if adding portable water tanks in the bilge is doing anything and how much.

Above is what I do on my android phone. My wife had to school me and she has an iphone, so I assume some of this is universal. Once I got it down, much easier to time than using the stop watch on my phone. And I can archive the files on my phone or my computer. I'm still trying to figure out how to use the .cvs data files on Excel. So far, I'm with you in that it is basically gibberish. I would really like to see the sine waves of various alterations overlayed to get a graphic picture of what little changes to stability and roll attenuation look like.
 
Marco
I also have the same app, Physics Toolbox on my iPhone and iPad.
How do graph only the Y function?
How do get longer time periods on the screen? It only shows me 18 seconds total.

As of now, my portable water ballast tanks are empty. Once I figure out how to get the graphical data, I will include them into the tests.
 
I think I've got something.
 

Attachments

  • IMG_0345.png
    IMG_0345.png
    83.4 KB · Views: 11
  • IMG_0344.png
    IMG_0344.png
    76.3 KB · Views: 12
Few other tries.
 

Attachments

  • IMG_0343.png
    IMG_0343.png
    91.9 KB · Views: 15
  • IMG_0342.png
    IMG_0342.png
    134.6 KB · Views: 11
  • IMG_0341.png
    IMG_0341.png
    110.4 KB · Views: 13
LeoKa,

Go into the app's settings. It records X, Y, Z, and G (G being the total). X, Y, and Z are roll, pitch, and heave in boat terms. You are only interested in roll right now (Just X, the red line). Turn off everything else.

Although the program is an accelerometer, I use the G-force meter (three bars on upper left opens the toolbox choices).

Place the phone down on the helm or side deck pointed to the bow and aligned with the centerline. (If the phone isn't level, the zero mark won't be accurate, but doesn't matter that much as we are just timing the roll). Also at the top of the app you can rotate the graph on the screen. Even though the screen is rotated, when making a graph the phone still has to be pointed towards the bow for the X axis to record properly.

While the app is running, you can use your fingers to set the size of the graph you want. Your chart was only for a few seconds. "Pinch" on the graph and you can show a minute or two on the graph. Same with the force axis. If you set that to something like .2 G showing on the screen, the graph will make larger waves that are easier to measure. You can also move the screen so that the zero point is mid-screen.

Then rock the boat and, when the graph fills up the phone screen, use three fingers to save the chart as a screen shot. No need to save .cvs files; a picture tells enough for now. Looking at a long string of waves on the graph picture makes it easier to get timing down to an accurate tenth of a second or better. In "Roll To Beam" calculation, 10ths of a point make a difference (a .97 RTB compared to a 1.1 RTB), so accuracy is required.

Based on your first picture, it looks like it may begin with a single roll at a period of about 6 seconds. Then there are some spikes which I assume is walking on the deck or touching the phone. You need a longer record and a cleaner graph, then you can assess whether alterations to ballast or moving ship's stores are doing anything.
 
Marco.

Either I am a total idiot, or something is wrong with my version of this app. iPhone OS version could have bugs. I have even purchased the PRO upgrade.
I am not able to filter out the red line in the G-Force. Only in the Linear Accelerometer. However, there is no option to show more than 18 seconds on the graph. I tried everything.
The saved .cvs file can be useful, but not user friendly. If I check the .cvs file for Peak to Peak numbers, it is almost exactly 7 seconds all the way. That is a full roll. So, I just have to settle with this number for now.
Thanks for your help.
 
OK, I watched the tutorial on the app's website and it is different. iOS has bugs and missing features. One of them is being able to view the recorded file. The other, I cannot filter out only one ax for data, no matter the settings. I wrote to the developer and they told me that a new update coming in few weeks to iOS, which will fix things. They also admitted that the ax filtering had a bug and they fixed it. We'll see.
 

Latest posts

Back
Top Bottom