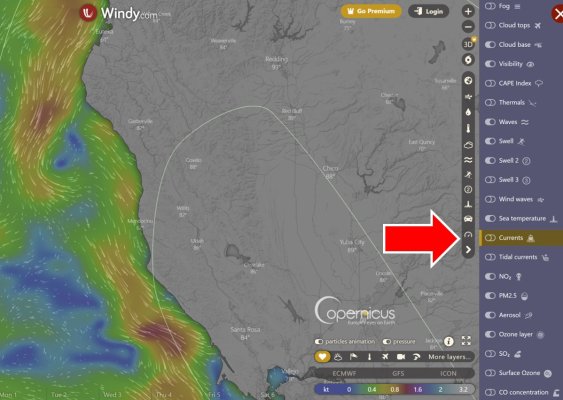
Doug - Getting in to Fort Bragg fuel dock is shorter than Bodega. Toss-up on which place I'd rather be stuck in. Marina at Fort Bragg is too far to walk to town, but Uber would work. Assumes you have fuel to get to Fort Bragg. 60g to Eureka might be tight - I figure you had around 275nm when you wrote this last post. Eureka is a great stop - docks are right in town; and it's a charming town ---- right out of Central Casting.
I pulled some of the NOAA Surface Charts to see the underlying weather systems that drive the outputs on Windy. i'm sure Doug is way ahead of me, but thought I'd share some of my approach/strategy from 20-years ago when I was delivering along this coast. I'm a bit rusty on weather (this is practice for me, so forgive me if a bit off). For those unfamiliar with the coast, I've put purple stars at Seattle and San Francisco (SF).
https://www.weather.gov/marine/ptreyes
In my opinion, there are two dominant weather items to watch along this coast: Pressure gradient between HI and LO pressure systems; and storms that clock-down from Gulf of Alaska (winter mostly but can easily influece swell for close to 1000nms). The H/L pressure systems move in an easterly direction, and tend to slow-down when they hit land. This creates a compression zone along the coast that extends out 100's of miles.
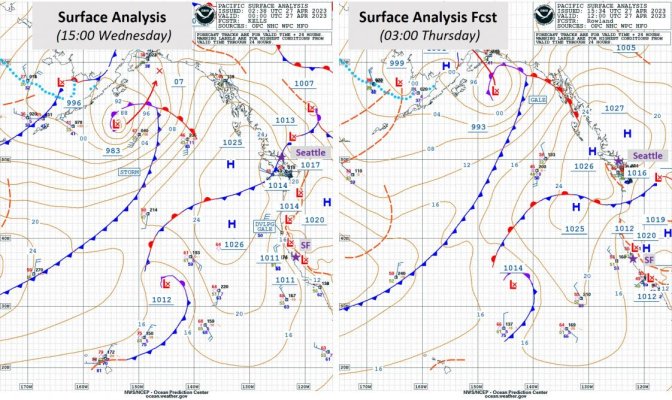
1. Yesterday and today's surface analysis charts. These charts endeavor to provide real-time conditions. They are an excellent learning tool if you're on the water as you can see what you
thought you'd get compared to what you
actually got . AKA 'School of Hard Knocks."

A few items of note - first, these two charts are by two different NOAA forecasters, "Kells" on the right (yesterday) calls for a developing gale. I don't know why - 12-hours later, "Rowland" does not call it out. Second, the red dashed line with "L" along it is a low pressure trough line - note it's deepened from 1114mb to 1112mb over the 12-hours.
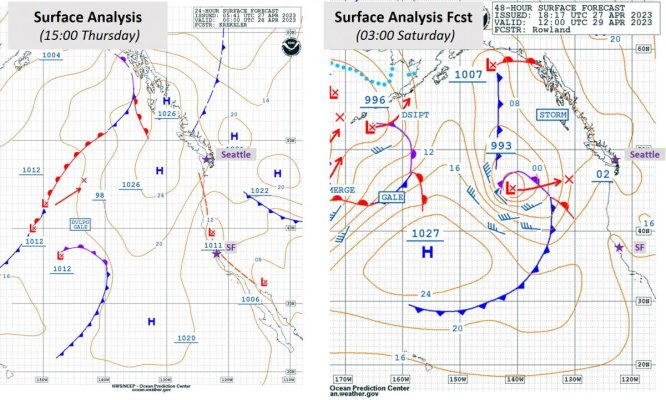
2. 24-hour and 48-hour Surface Chart forecast for today through early Saturday.

Again, two different forecasters. The one on the right is the 48-hour forecast and was, by far, my most favored forecast because it frequently showed movement of the pressure systems. Note the arrow between the two "X" on the low pressure system off Washington - and note how far apart the iso-bars are along the coast meaning there is little wind. Also note there may still be wind from diurnal changes - often at daybreak/sun-up it can get pretty windy. But it's not from the compression zone.....a good thing.
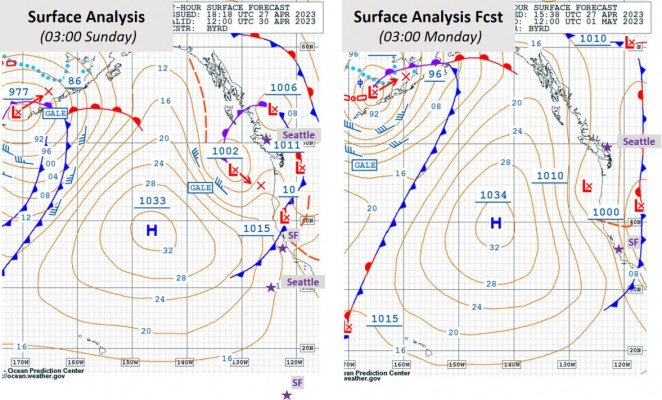
3. 72-hour and 96-hour Surface Analysis (Sunday and Monday)

72-hour/96-hour tends to be 'witch craft' zone for forecasting. That said, the low pressure trough has been really consistent for several days so it may be more accurate than normal. Forecast calls for a cold front passes through; and the Low Pressure trough has deepened to 1000mb creating more pressure gradient. There is also a strong system in the Gulf of Alaska that will spin junk down south. What happens on Sunday is a bit beyond me - the 1010mb low just off the WA coast could move west which may mean Doug could squeek by.
I really like the NOAA forecast products because they have a human being who interprets the data. The six charts above are the work of four different forecasters. Even in electronic format you can see some differences.
Bottom Line - It's 14:00PM PT Thursday as I write this. Given what I can [hopefully] deduce from the Surface Charts above, I'd plan to be settled somewhere by Saturday night - about 54 hours from now. Ballpark guess that Doug probably has around 240-250nms to Eureka, or 42-45 hours of running; plus 5-7 hours for fuel either in Bodega Bay or Fort Bragg. Neither is great to enter in the dark, though if I had to pick, would be Bodega Bay even though I've seen two boats miss the dog-leg turn, presumably due to fatigue. Also, I think the fuel dock at Bodega may be on-call/24-hours.
I'll be anxious to see if Doug makes it to Eureka. And I'll be anxious to see what changes, what mistakes I made.
Peter


